Understanding End-User Intent
You are likely considering a business intelligence solution because your users find the process of searching for information to be frustrating.
Creating actionable intelligence to overcome this frustration requires a combination of business, analytic and technical skills.
The first step in deploying BI is to consider carefully how the information will be applied. Dashboards and reports should quickly provide information to help executives, managers and front-line personnel achieve one or more business objectives. The objectives will vary according to the role of each user or user group.
The dashboards you develop will typically fall into three category types:
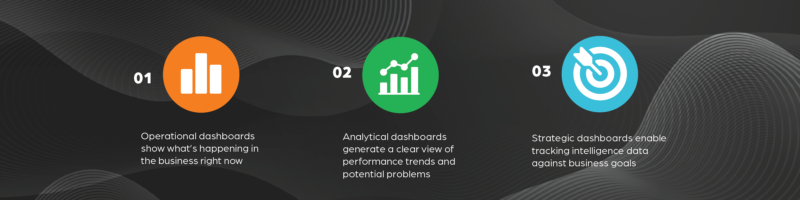
As you create dashboards that lead to detailed reports, it’s usually best to keep the three types separate to align with the analysis process that people naturally follow. In cases where end-users need to analyze intelligence on multiple levels at the same time, it may make sense to combine two or three types into one dashboard.
User Personas Play Key Role in Dashboard Development
To define what each dashboard should entail, start by identifying the different personas that require dashboard views. The personas may represent senior executives, business unit managers, or front-line teams such as sales, marketing, customer service, field operations, or warehouse operations.
Interview members of each persona group to find out which questions they are trying to answer—the drivers behind the need for the BI solution. Digging into the specific information they need to make decisions and to do their jobs is better than simply asking, “What do you want?”
Here are a few tips to keep in mind when you conduct the persona interviews:
• Document the flow of information as users tell you the questions they need answers to. What is the order of the questions they ask to do their jobs? When they have the information, how do they use it?
• Find out which data sources are currently used for information gathering and how users go about compiling the data. This will likely be a manual process, but it will give you insights into how the BI data model needs to be built.
• Ask why the process is inadequate and identify the user pain points. The data may come from multiple applications, spreadsheets, documents, or even conversations with front-line personnel.
• Create the dashboard for users by combining data from multiple sources; you may discover new processes are needed for capturing the data.
• Identify how often the dashboard will be viewed—daily, weekly, monthly, quarterly? Do end-users look at the dashboard individually or as a team as part of a regular meeting? Knowing the answers to these questions will play a role in the back-end processes to extract the data from various sources and how frequently the dashboard reports need to refresh.
Find out too what actions the end-users project they will be able to take once all the information is presented within a single dashboard. This information will drive faster decision-making, and you may discover generating helpful reports prompts them to ask more questions. These new questions may be uncovered during the interview process, but they may not emerge until after the dashboards start getting used.
By shaping user personas, you can consider the intent of the dashboards as you build them. This speeds up creation by enabling you to answer simple decisions on what to build into the dashboard— rather than going back-and-forth with users on the requirements. Knowing the intent will also allow you to build features that optimize the efforts of end-users when they interact with the dashboards.
Organizing Dashboards to Drive Adoption
If you are launching a BI initiative for the first time, you might have a large scope of work to cover and multiple personas to build dashboards for. You may not need to design a dashboard for every single use-case. It might make sense to wireframe the dashboards first to identify any overlaps and to determine which reports can be shared across multiple dashboards.
For example, a single dashboard can be used in hierarchical use-cases such as a corporate view of overall sales activity with sub-sections for regional reporting and district reporting. Different personas may use the same dashboard but with access only to the data that pertain to their job role.
While you can leverage some commonalities to design dashboards that serve multiple roles, don’t commit to combining too many reports so that building a dashboard is unmaintainable. Depending on the complexity, you may need to create separate dashboards.
As you design the data structure, keep in mind the top information points your end-users need to see. They should be flagged by the most prevalent and eye-catching elements of your dashboard. By eliminating anything in the views that is unnecessary, you can get users to the insights they need to make decisions faster.
Ideally, users should be able to gain high-level insights within five seconds. You can facilitate this with initial views that display aggregated information and then allow for drilling down into the info to answer more specific questions.
And as you present dashboards to end-user groups, it helps to tell a story. Show them what they can see, why that data is important (linking back to the answers you collected during the interviews), and what they can do next after getting that data.
Ultimately, you will give users the ability to access insights faster so they can make decisions sooner within business workflows. That will lead to increased adoption rates—both in the amount of time users spend with the dashboards and the number of users that rely on the dashboards.
Author: Jon Decowski