Oh, The Places You’ll Go… With Your Construction Data
To many construction firms, an analytics initiative can seem like a towering, seemingly endless mountain to climb.
With numerous components to consider (integrations, data warehousing, data normalization, and visualization), this first venture into analytics can be intimidating. Oftentimes, however, this journey is rewarded with new, actionable insights that can be leveraged to improve decision making and increase efficiencies.
With such monumental benefits, why doesn’t every business strive to ascend the analytics mountain? Many don’t have the resources in-house to tackle these initiatives and building the infrastructure to support one can be time-consuming and costly. This of course isn’t the end of the road. There are always analytics as a service offerings to assist along the way. For construction companies, the Caliper platform can be a great first step on the journey of analytics. With standard integrations, data-warehouse infrastructure, and pre-built visualizations, there’s no better way to jump-start an analytics initiative and hit the ground running towards meaningful insights.
Caliper syncs data nightly and creates extracts to keep data at your fingertips with load times typically under five seconds. With built-in functionality such as drill downs and hierarchies, it is possible to go from a birds-eye-view of data to all the way down in the weeds looking at individual transactions. Caliper offers a module-based reporting package, including many different dashboards for various types of end-users. This allows firms to only pay for what they want and need.
The base construction module contains job cost data and includes, but is not limited to, dashboards such as Project Management, Performance vs Estimate, and Project Flash Report. The Project Management dashboard is designed to give PMs helpful data on the jobs they are managing. It provides a glimpse into billing, backlog, contracts, and costs both at a high level and by individual job. The Performance vs Estimate dashboard gives insight into margin performance vs estimates for closed jobs and can be broken down by many groupings such as project manager, customer, year, job type, etc. With a scatter plot of Jobs plotted on actual margin vs estimated, it is easy to spot when there are issues or simply just a few outliers. The Project Flash Report visually represents a job over the course of time. Along with simple information about the job, you can see when change orders came in, when and for how long a project was over/under billed or cash positive/negative.
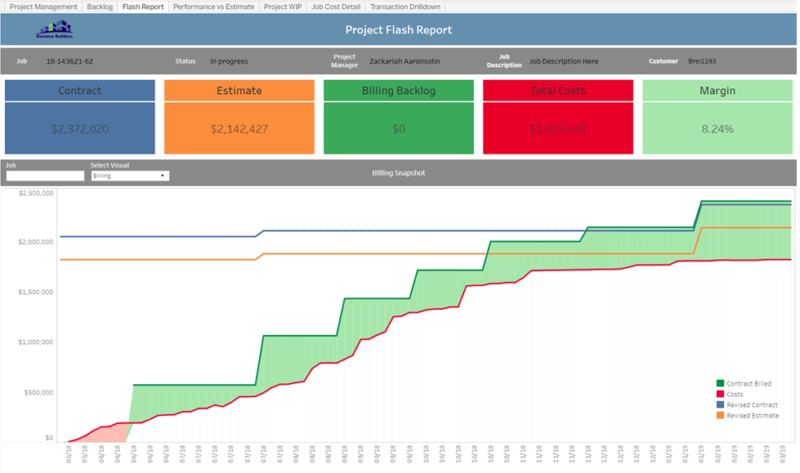
Ex. Flash Report
Along with Caliper’s ability to present Job Cost data, there also is a Forecasting module that allows for PMs to write data back into the data-warehouse and create a cost-to-complete (C2C) forecast. The forecasting tool is configurable, allowing for forecasts at any level from job to cost category to individual cost-codes. On top of this, the C2C entry is also configurable with entry options of Dollars, Hours, or Percent Complete. With the C2C entered, these remaining costs can be allocated over future months to help accurately predict when backlog will burn down. This tool not only streamlines forecast generation and more accurate WIP generation, but the data is used in additional reporting and dashboards within Caliper. The Forecast module supplies a forecast flash report, which acts as a one-stop-shop for all metrics relating to a forecasted job such as Margin gain/fade and hours & costs to date and remaining. This is also a point in time report. It will display forecasted margin over time and can be used to see where a job was at any time it was forecasted. Additionally, Backlog Projections and revenue forecast dashboards are available.
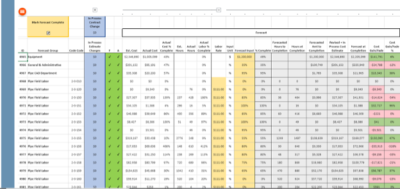
Ex. Forecast Entry
One of the biggest benefits of an analytics platform is the capability to pull and connect data and present it in one central location. The more data connected to the Caliper platform, the more these opportunities present themselves. With additional data from the Forecast and Financial modules dashboards will be slightly changed/upgraded. Within construction all forecast data for % cost complete will be used in calculations such as over/under billed and for margin metrics. The performance vs estimate dashboard will now include in-progress projects. On the Project Management dashboard, PMs will be able to see their open AR and DSO for their jobs. All this data can be presented in one spot in the blink of an eye, automating inefficient processes such as of running multiple reports out of a system, data dumping into Excel, and manually piecing together necessary information.
Analytics is ever evolving, like growing your business or improving operational efficiency. As you set off on your analytics journey and become familiar with your data, many opportunities will present themselves for reports unique to your firm. Change orders, commitments, cash flow, bid reports, the possibilities are endless. Caliper provides the framework to confidently walk along the path of a data-driven business. It’s up to you to take the first step.
Author: Ian Netland